Private project
Portfolio Pulse
Month-end credit portfolio reporting for management, processed locally from the loan workbooks.
Internal tool: the source code isn't public.
- Type
- Internal tool
- Built with
- TypeScript · React
- Runs on
- Windows PC · Synology NAS
- Network
- Offline, office LAN
What it is
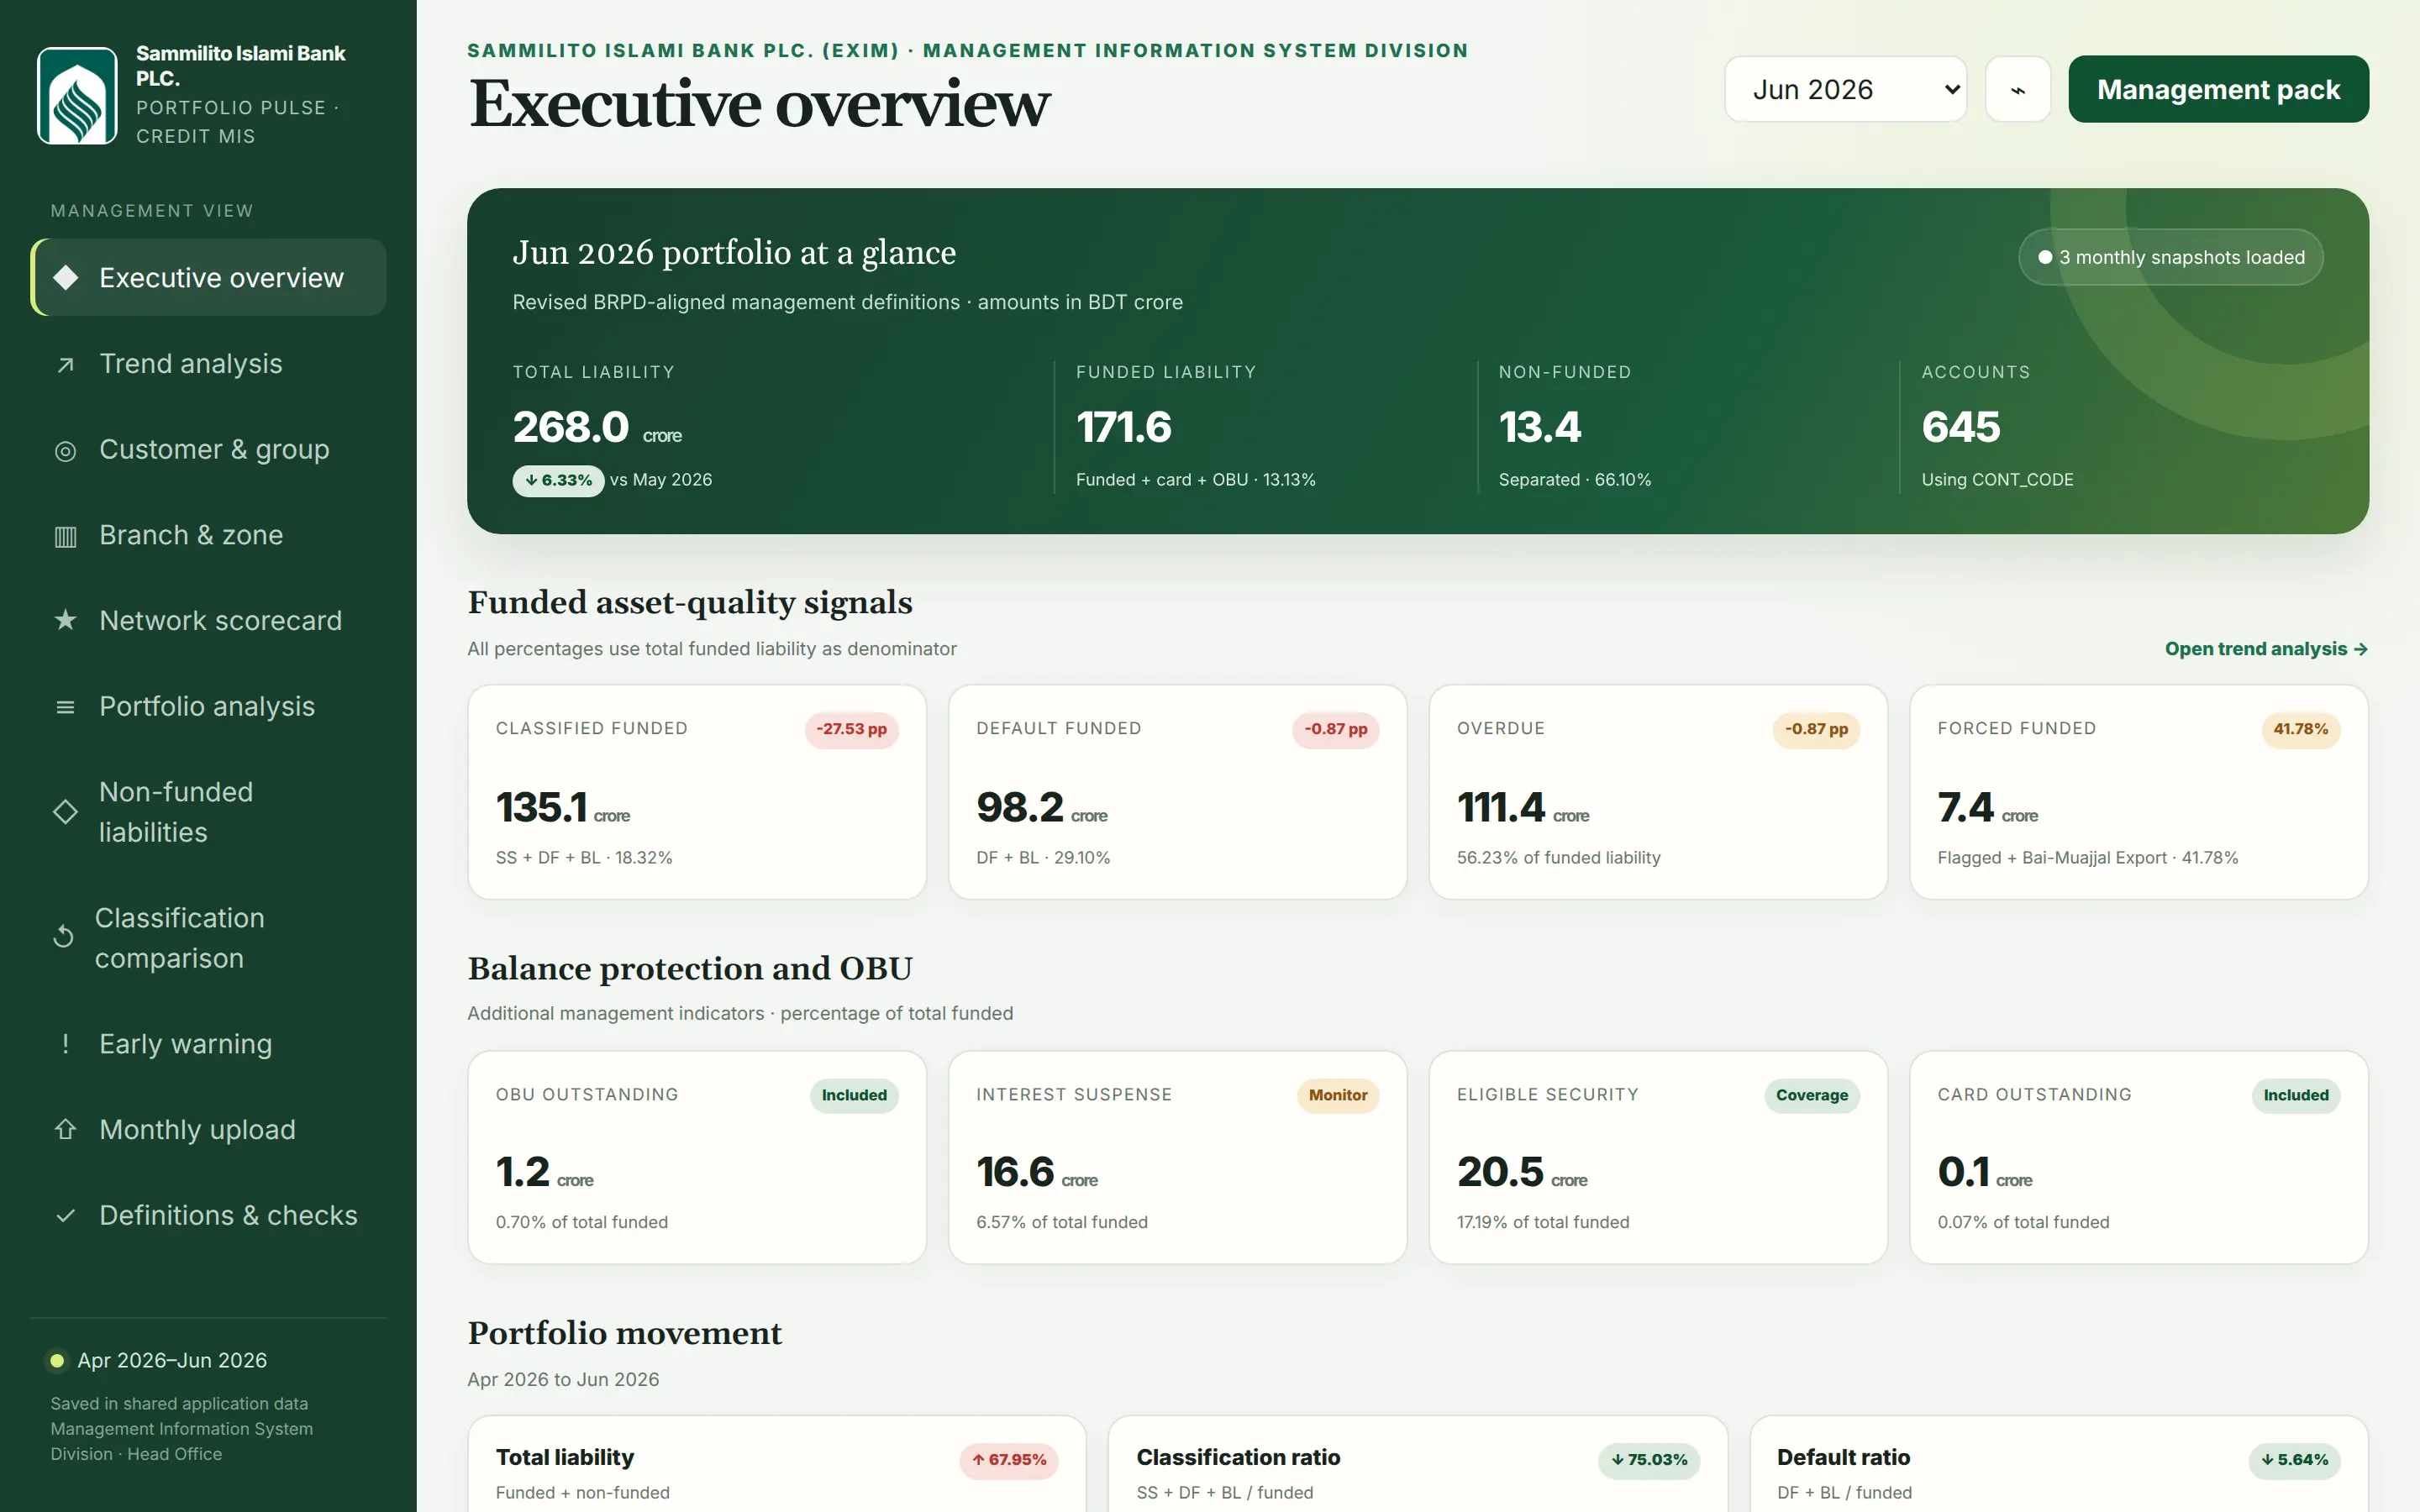
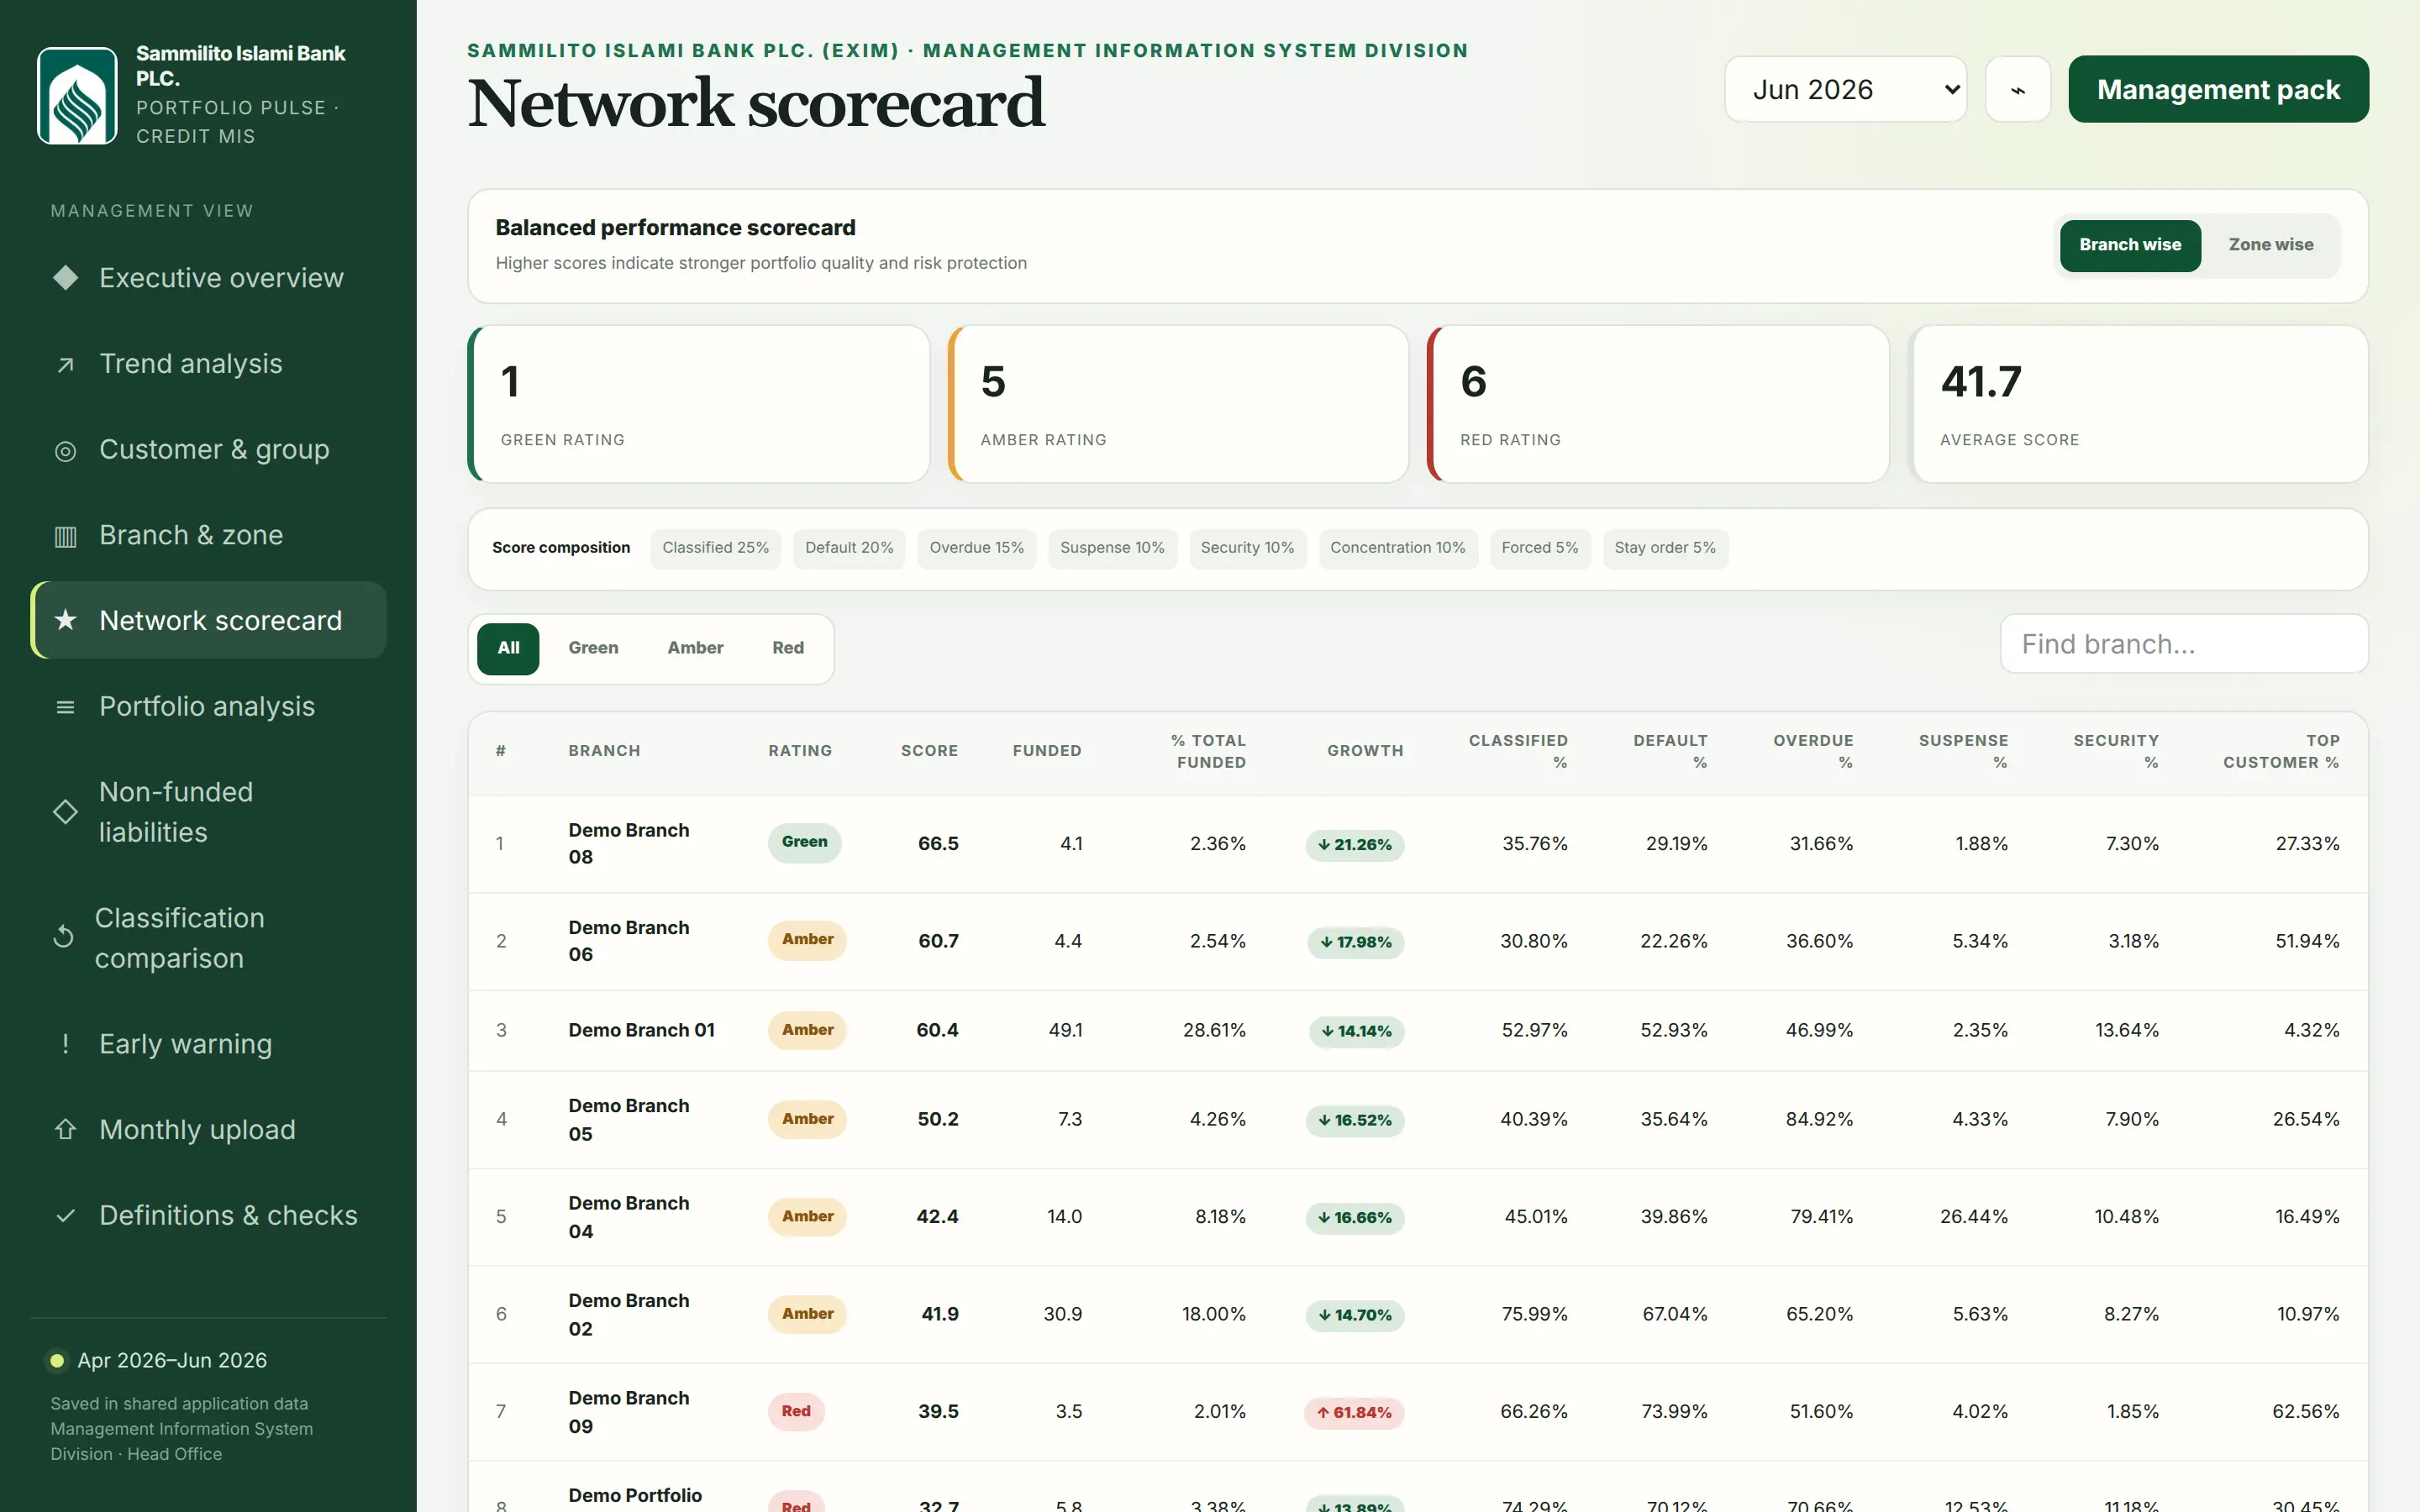
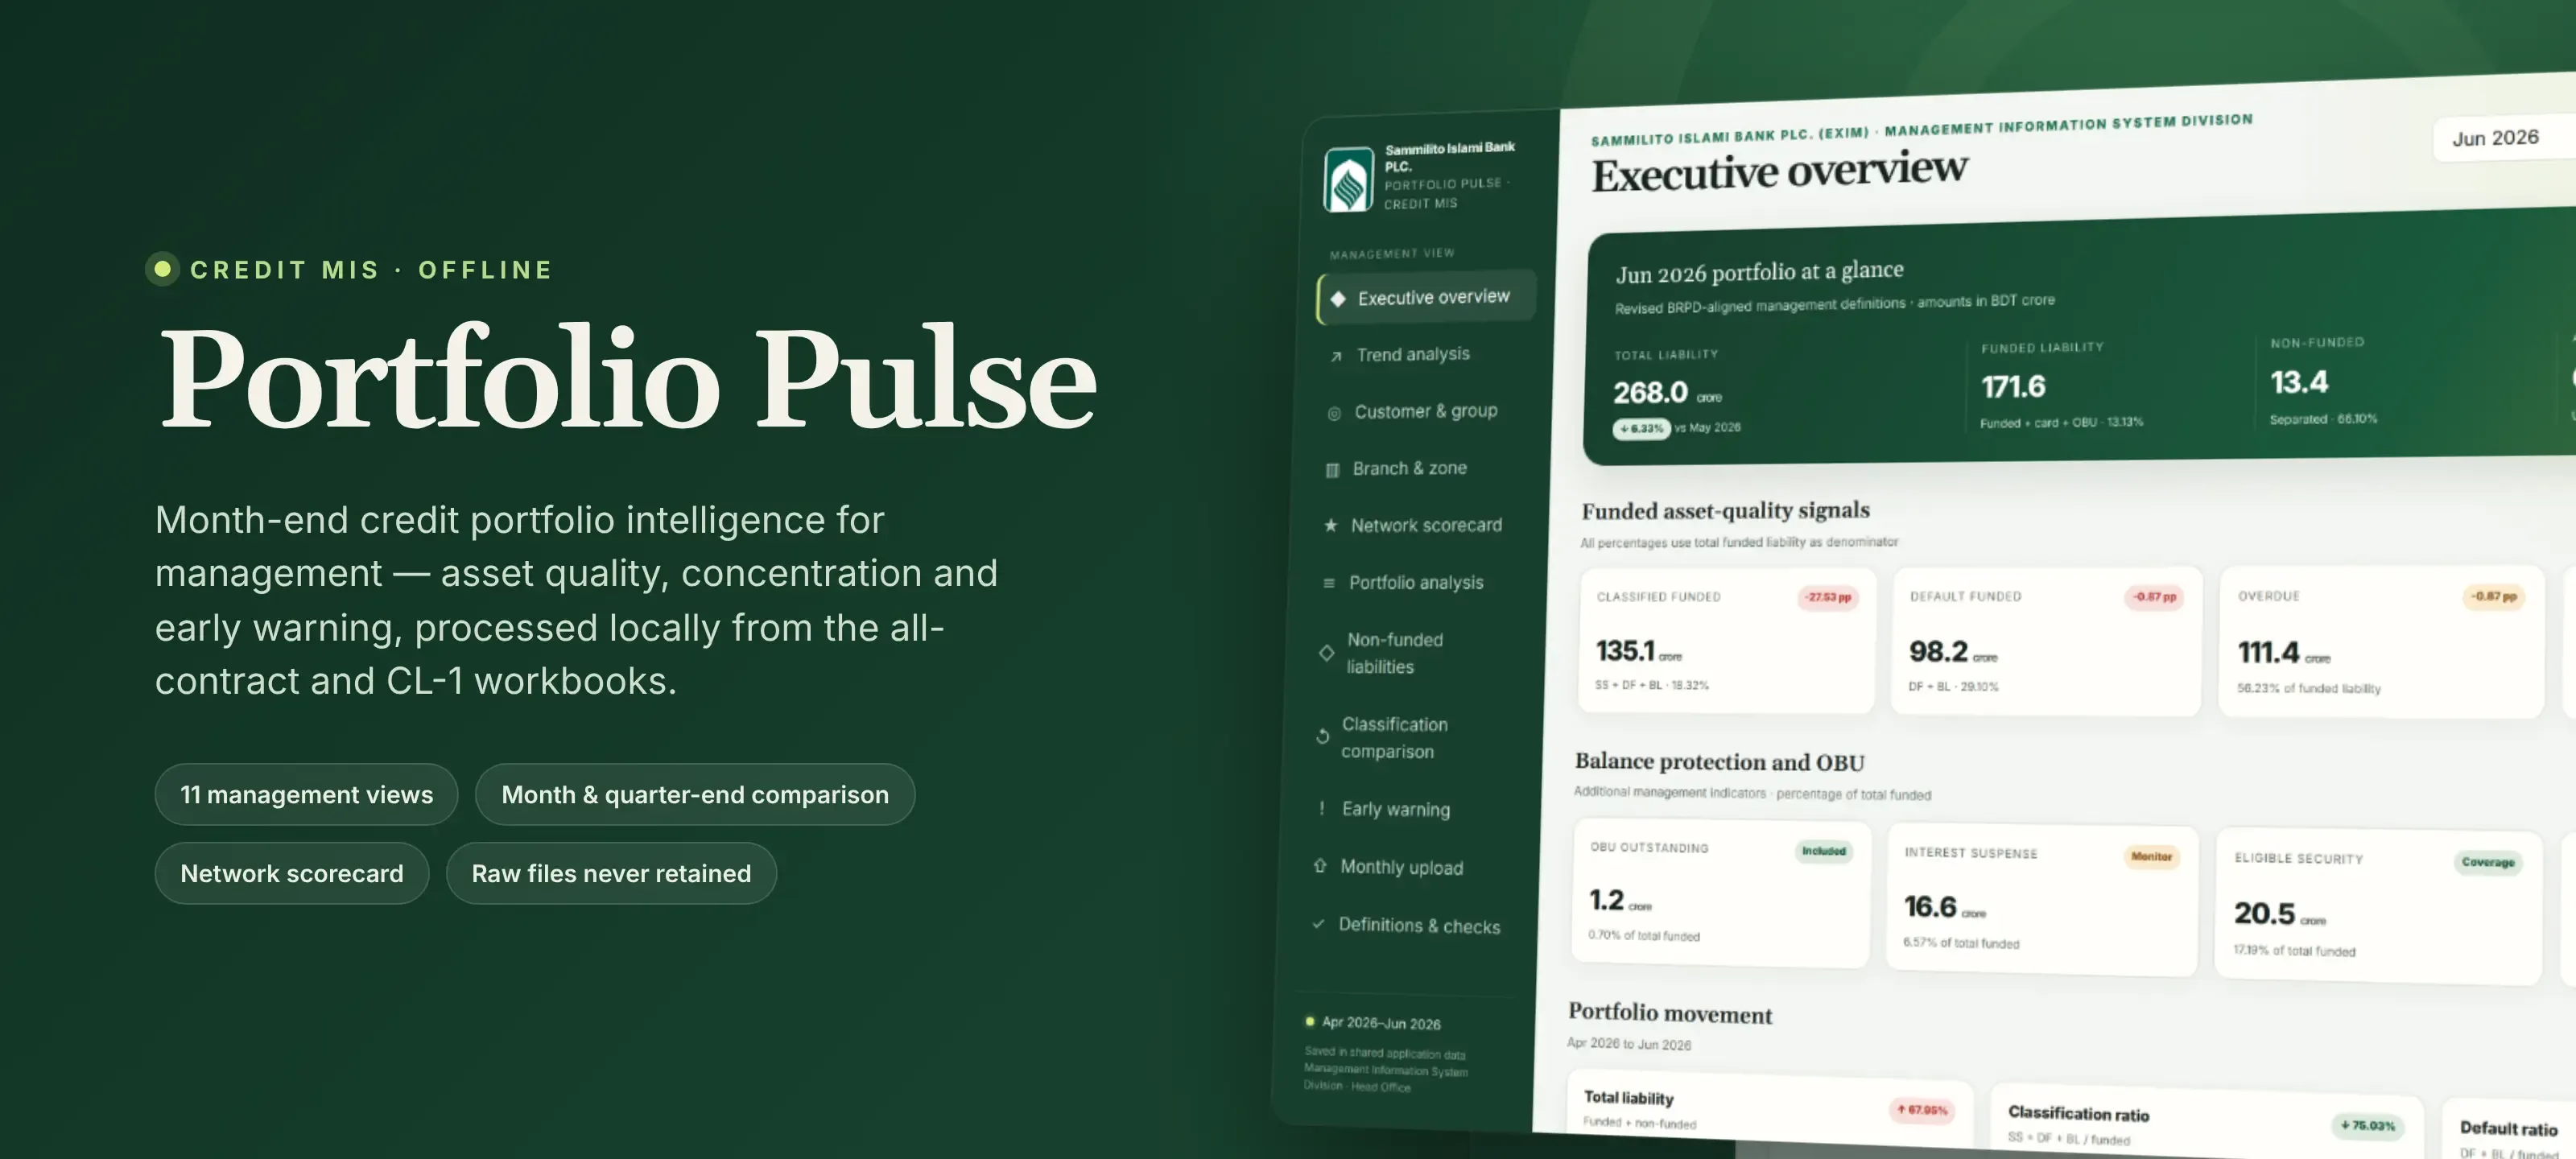
Portfolio Pulse is a management information dashboard I built for my work in banking MIS. Every month-end, the credit portfolio arrives as large Excel workbooks. Portfolio Pulse turns them into a set of management views covering asset quality, concentration, branch performance and early warning, ready to review as soon as the month is approved.
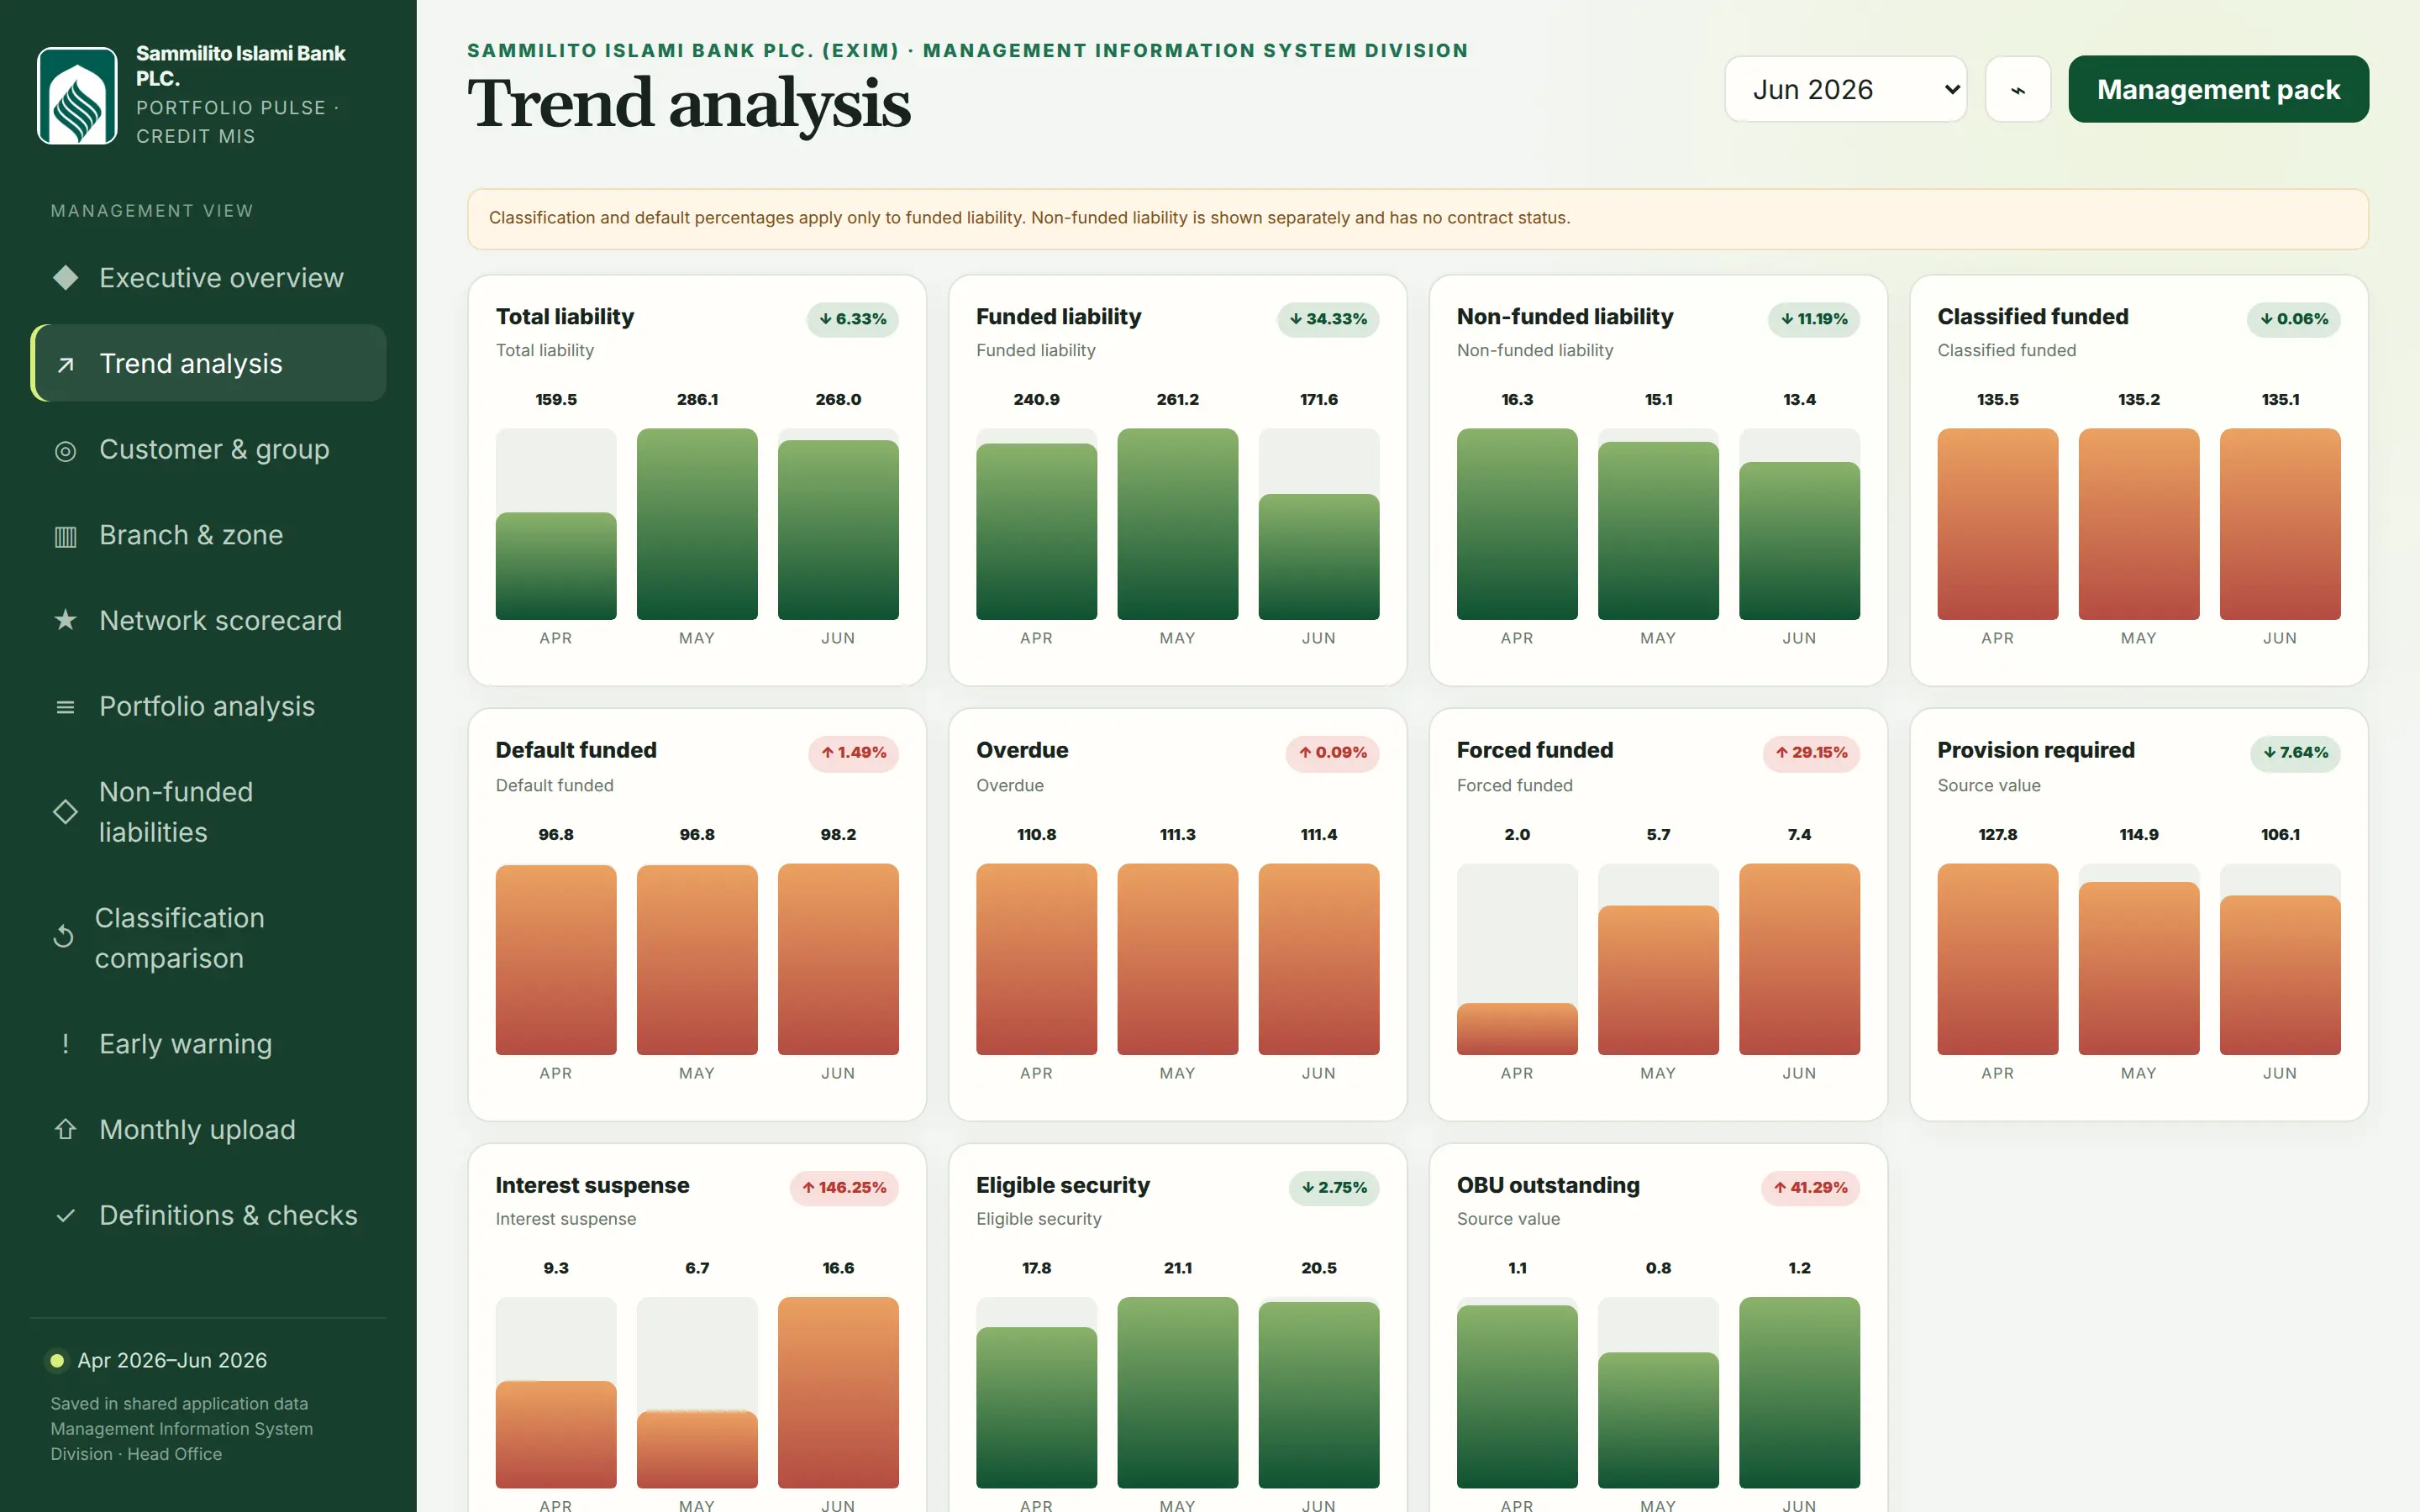
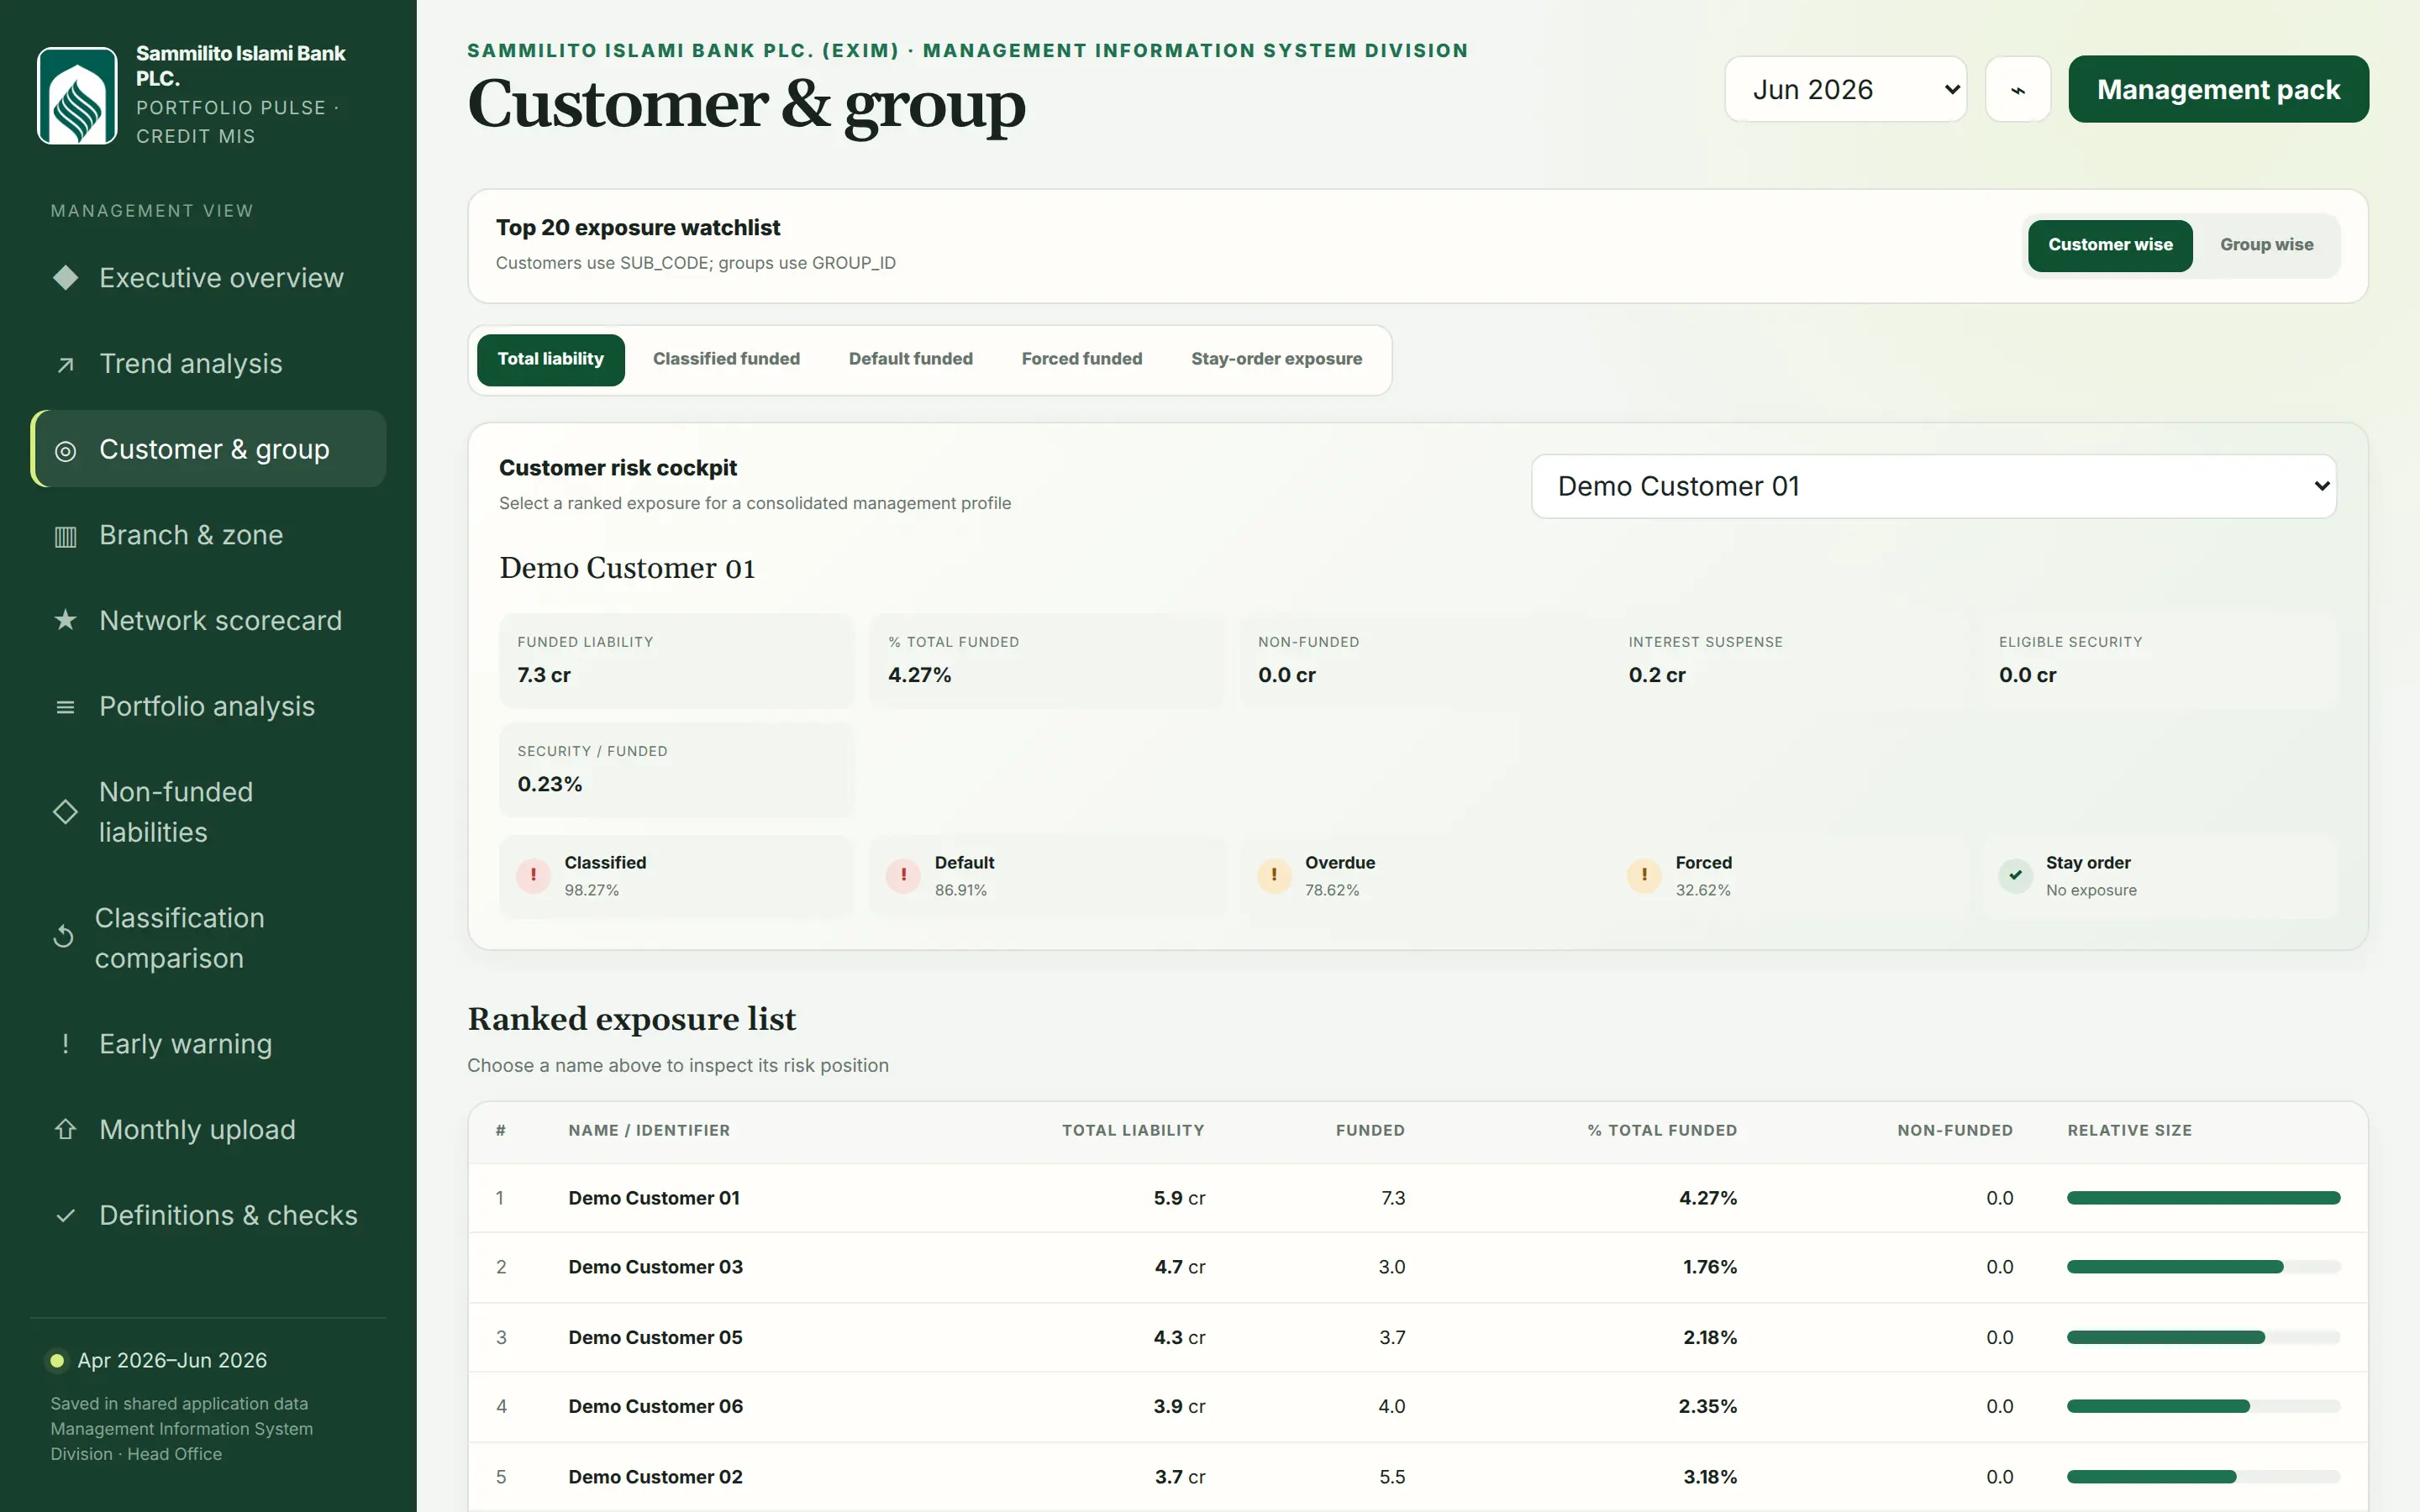
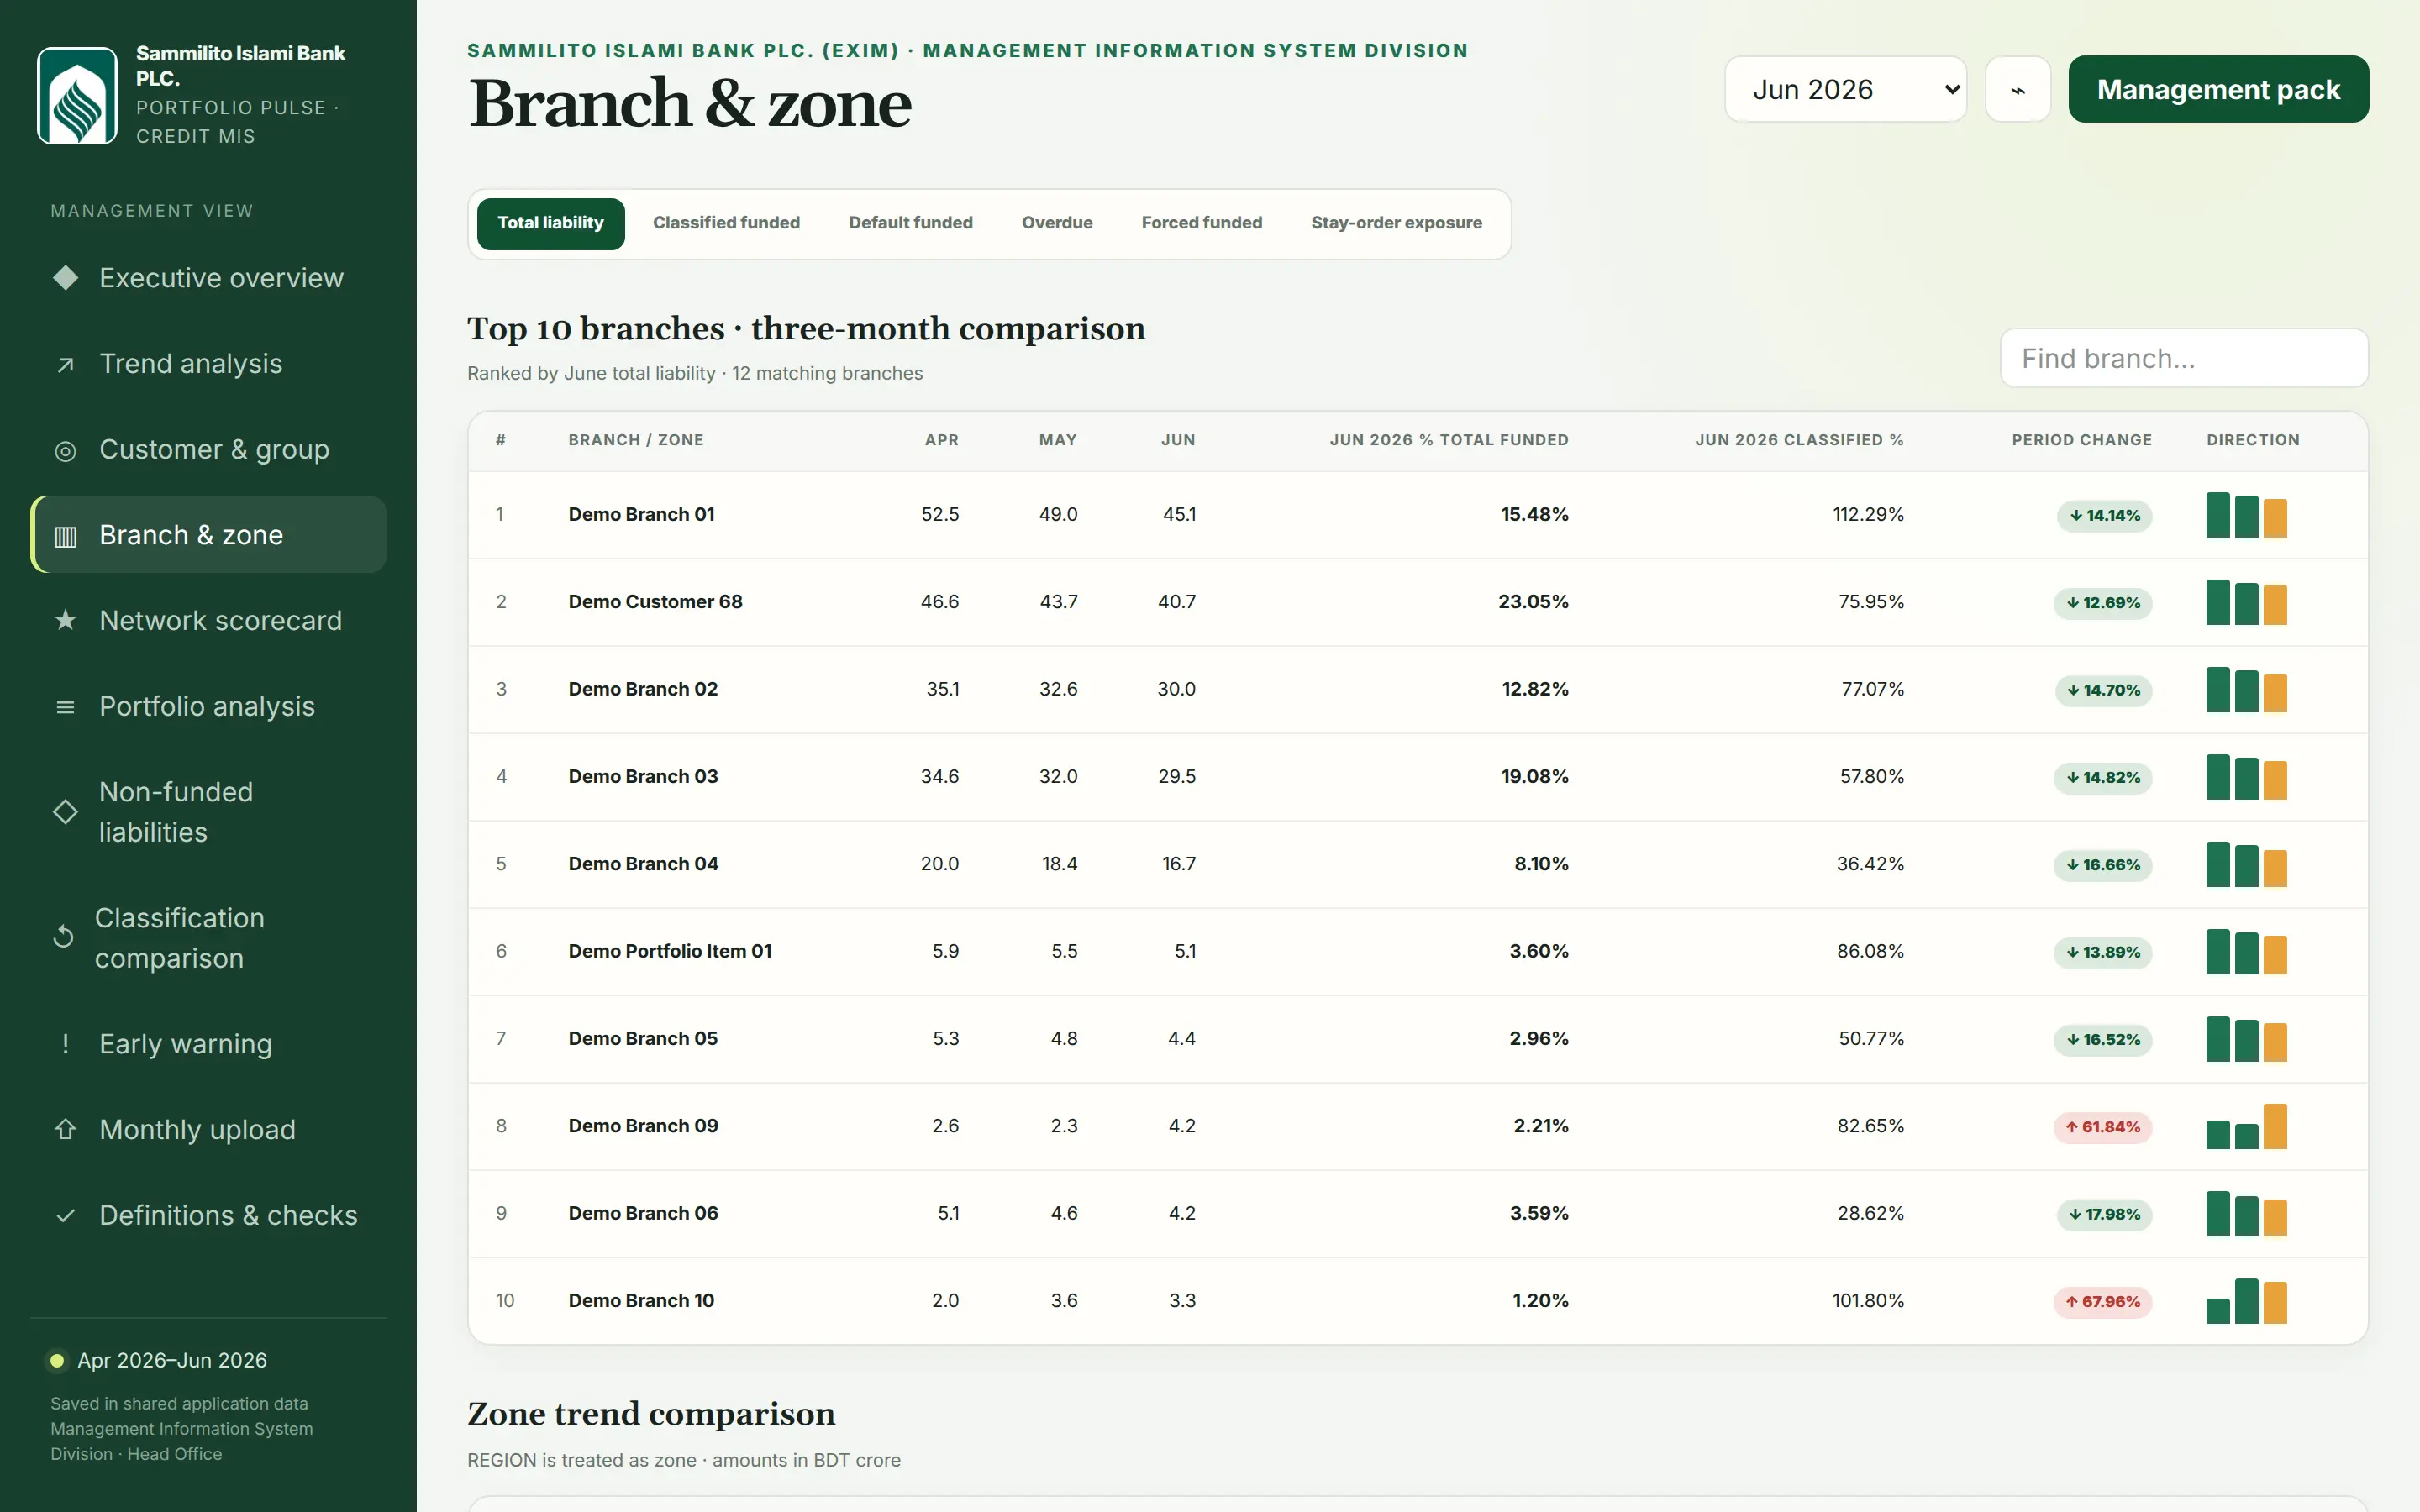
It’s an internal tool, so the code isn’t public. The screenshots use synthetic demonstration data.
What it does
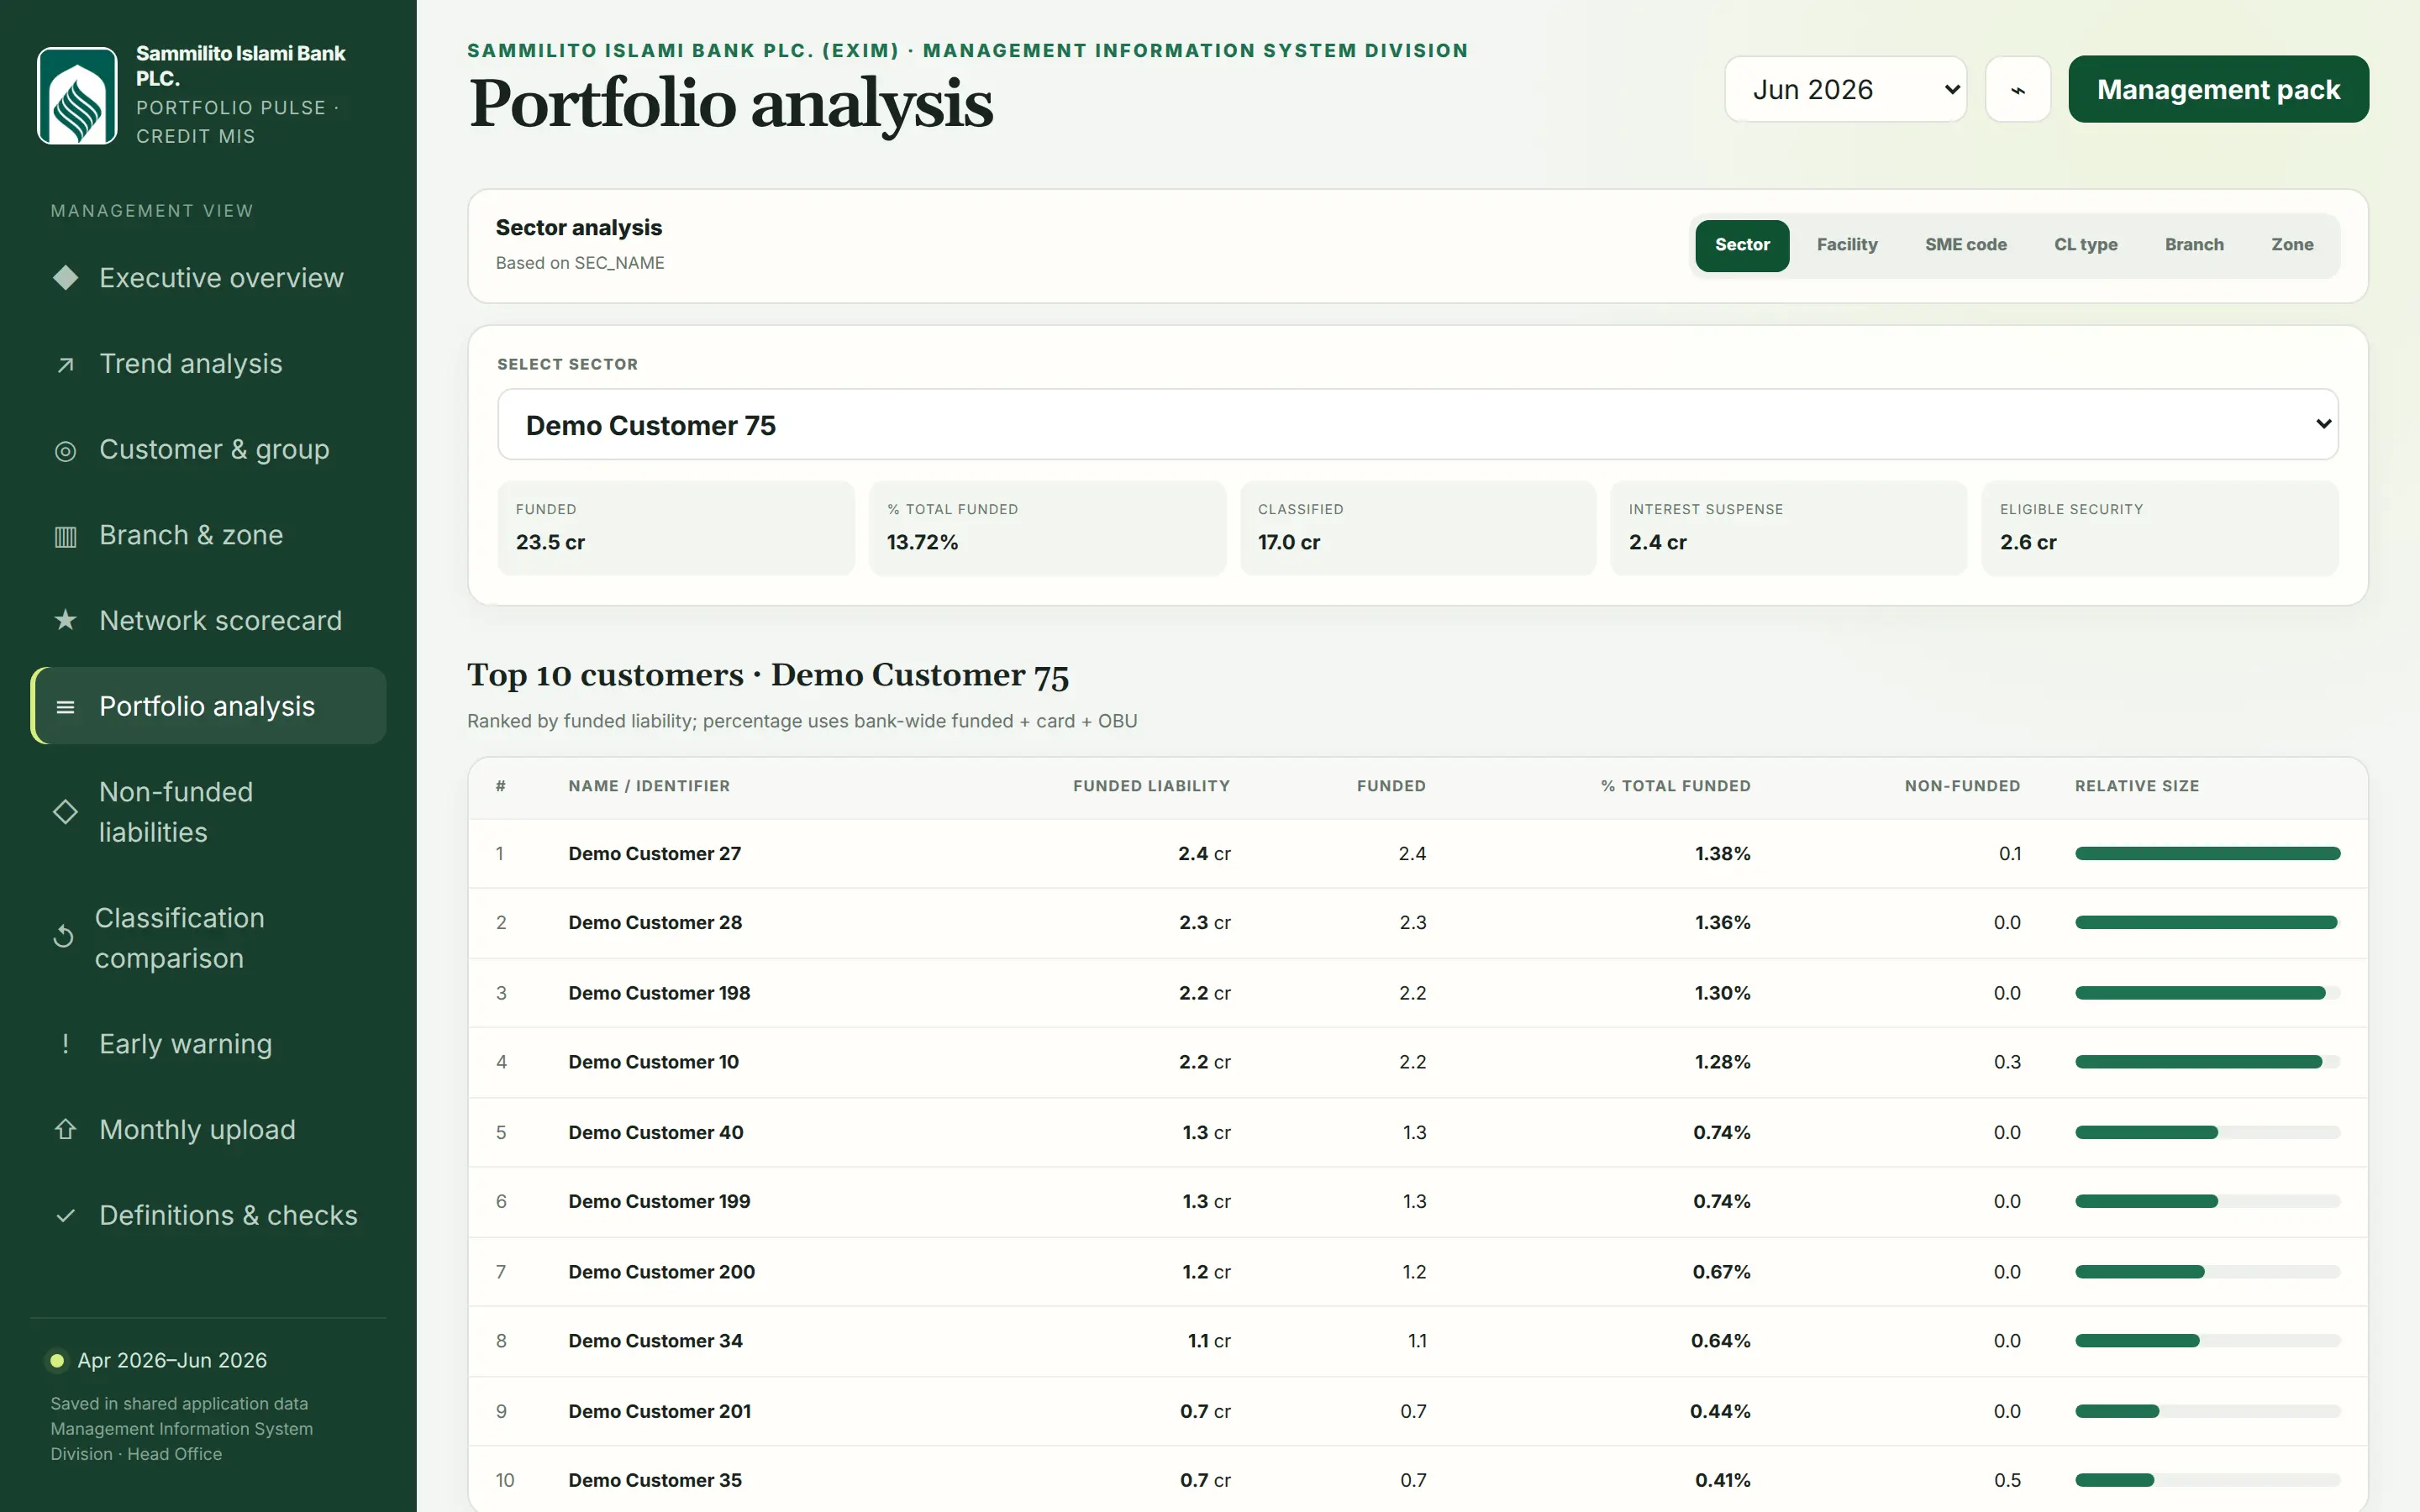
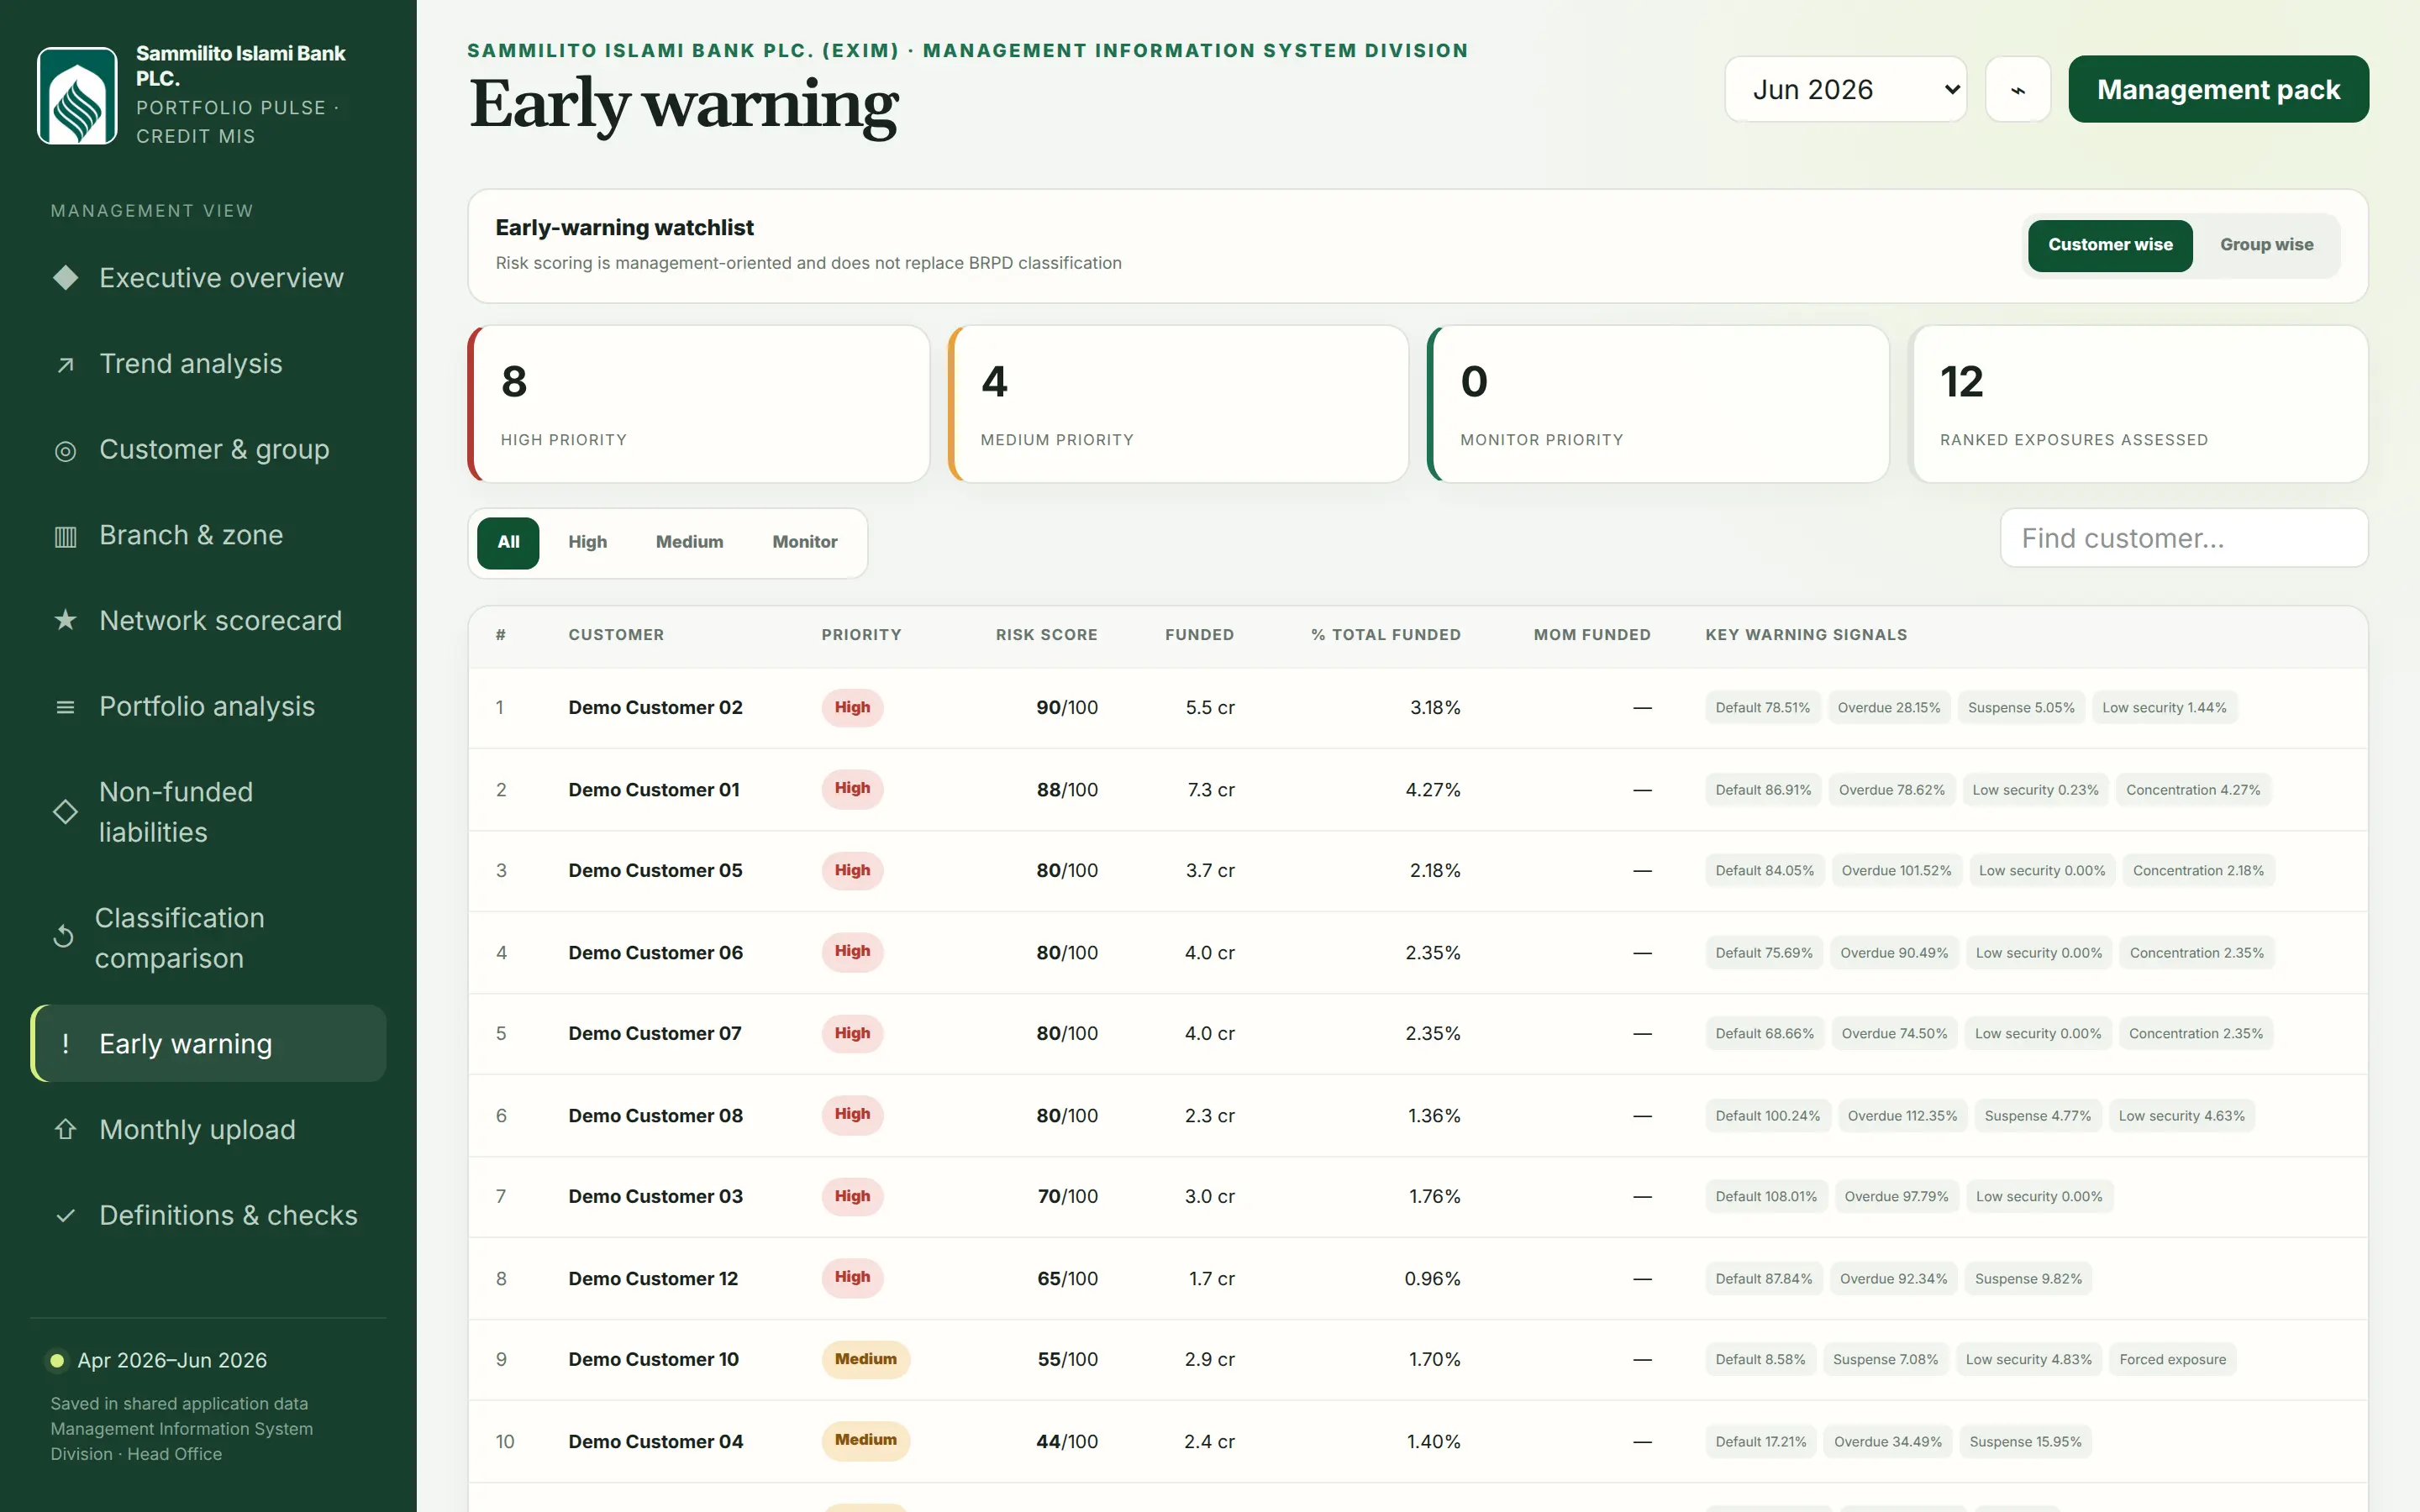
- Eleven management views, from an executive overview and trend analysis to customer and group exposure, branch and zone comparison, a network scorecard and an early-warning watchlist.
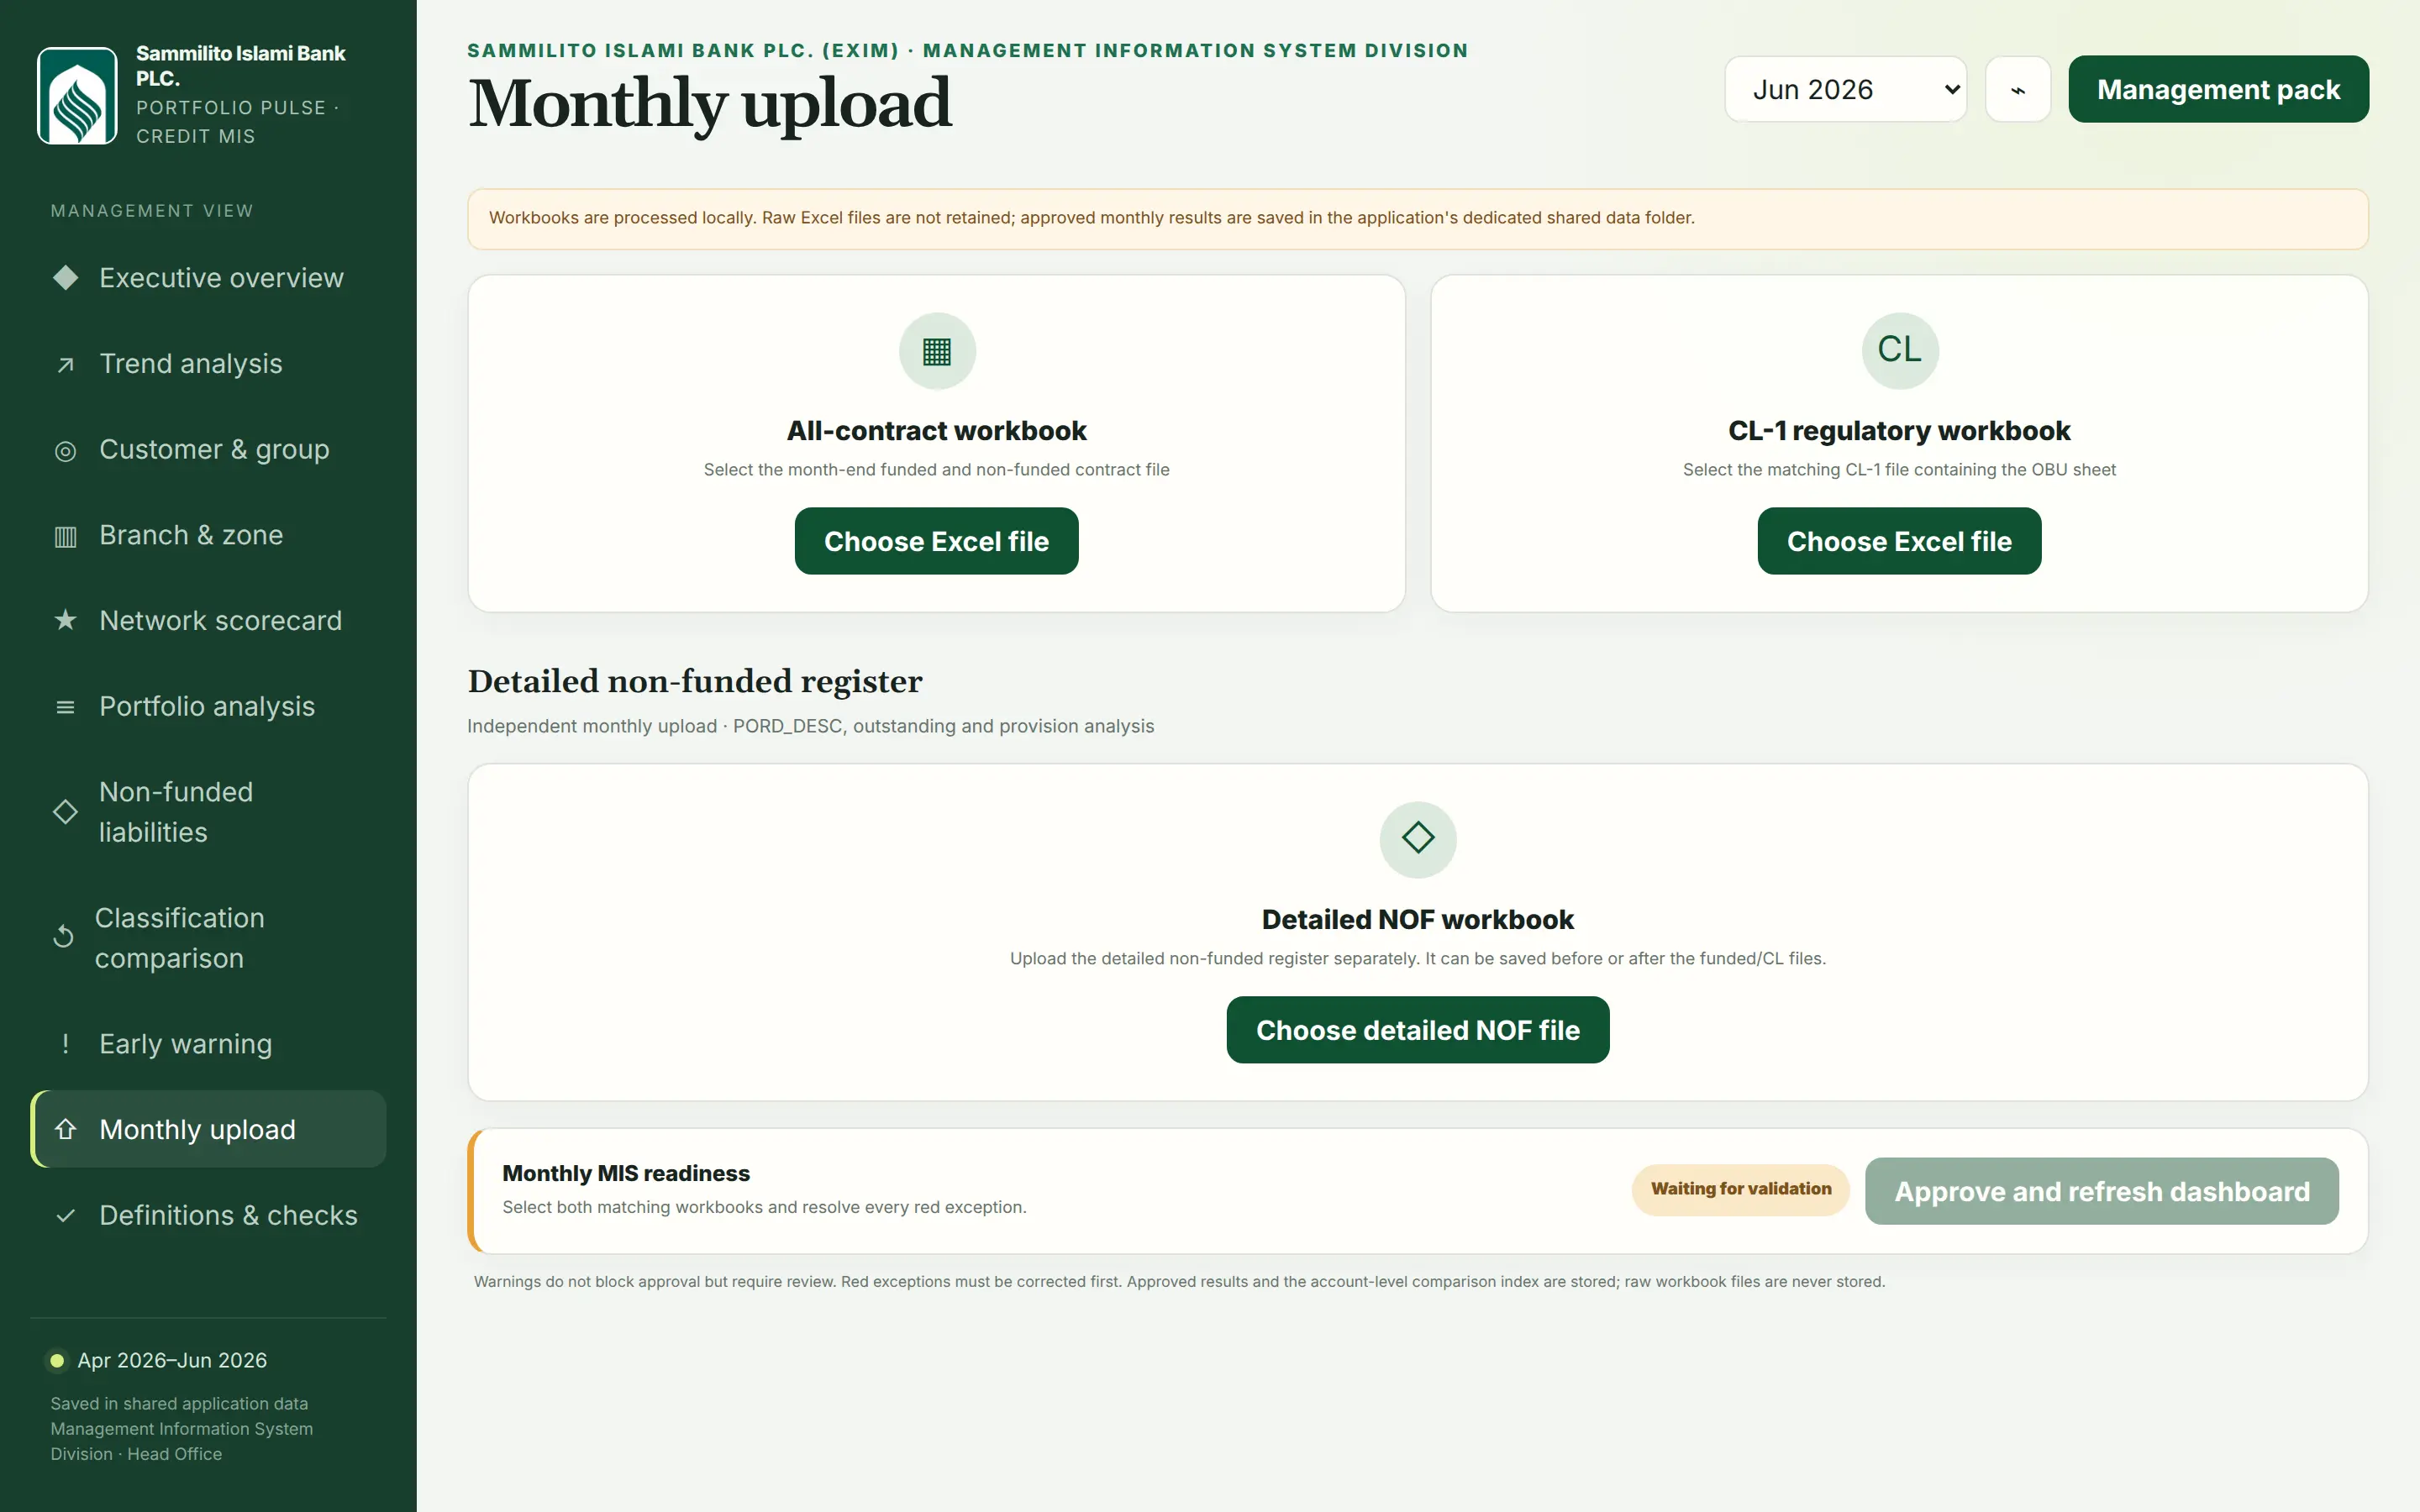
- A guided monthly upload. Select the month-end workbooks, resolve any blocking validation exceptions, approve the funded snapshot, then save the non-funded month separately.
- Automatic comparisons. Each month is compared with the previous month and with the latest quarter-end, down to account level.
- History that stays put. Approved snapshots are kept in one shared file on the host PC or NAS, so every authorised browser on the office network sees the same months.
- Raw files never retained. Only processed snapshots are stored; the original workbooks are not kept.
How it’s built
The dashboard is a TypeScript and React app that processes the workbooks locally, so the data never leaves the office network. It ships as two offline releases: a dependency-free PowerShell launcher for a Windows PC on the LAN, and a container for a Synology NAS. An automated interaction audit covers all eleven pages, the approval flow, month ordering, quarter selection and historical trend values.
Screenshots